Interface Overview
Xplorer has a minimalistic, familiar interface designed for zero learning curve if you know Postman.
Main Layout
The application has three main areas:
- Left Panel (Folders): Tree navigation showing your collection structure
- Center Panel: Request details and response viewer
- Right Panel: Output, Environment, and Import tools
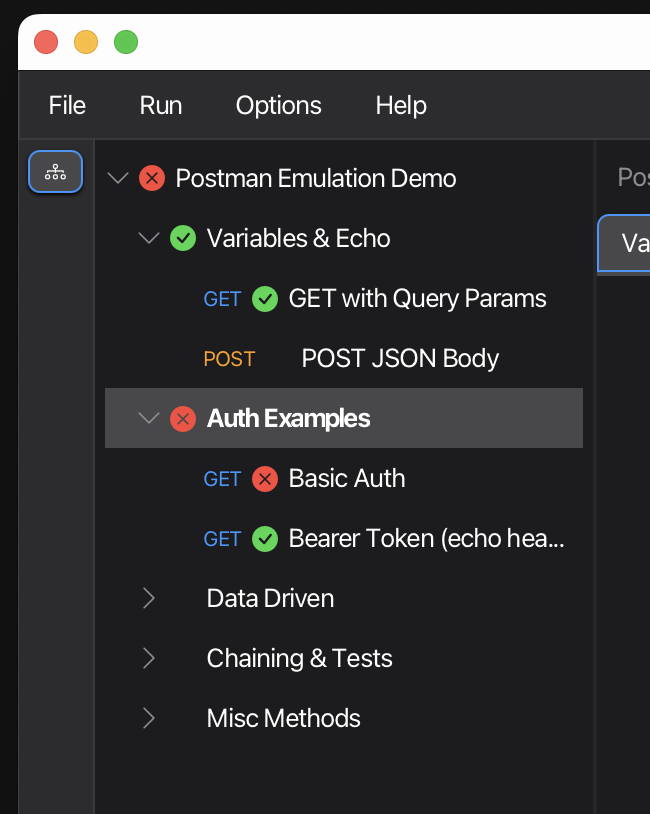
Left Panel: Navigation
The navigation pane displays your collection hierarchy as a tree.
Visual elements:
- HTTP method labels (GET, POST, PUT, etc.) for requests
- Folder icons with expand/collapse controls
- Pass/fail status indicators after execution
Interacting with the tree:
- Click any request to view and edit it
- Click the status icon to re-run a request or folder
- Right-click for context menu options
Status Indicators
After running requests, visual indicators appear:
- ✅ Green checkmark - Request passed
- ❌ Red X - Request failed
- Play icon - Not yet executed (appears on hover)
Folders show aggregated status of all contained requests.
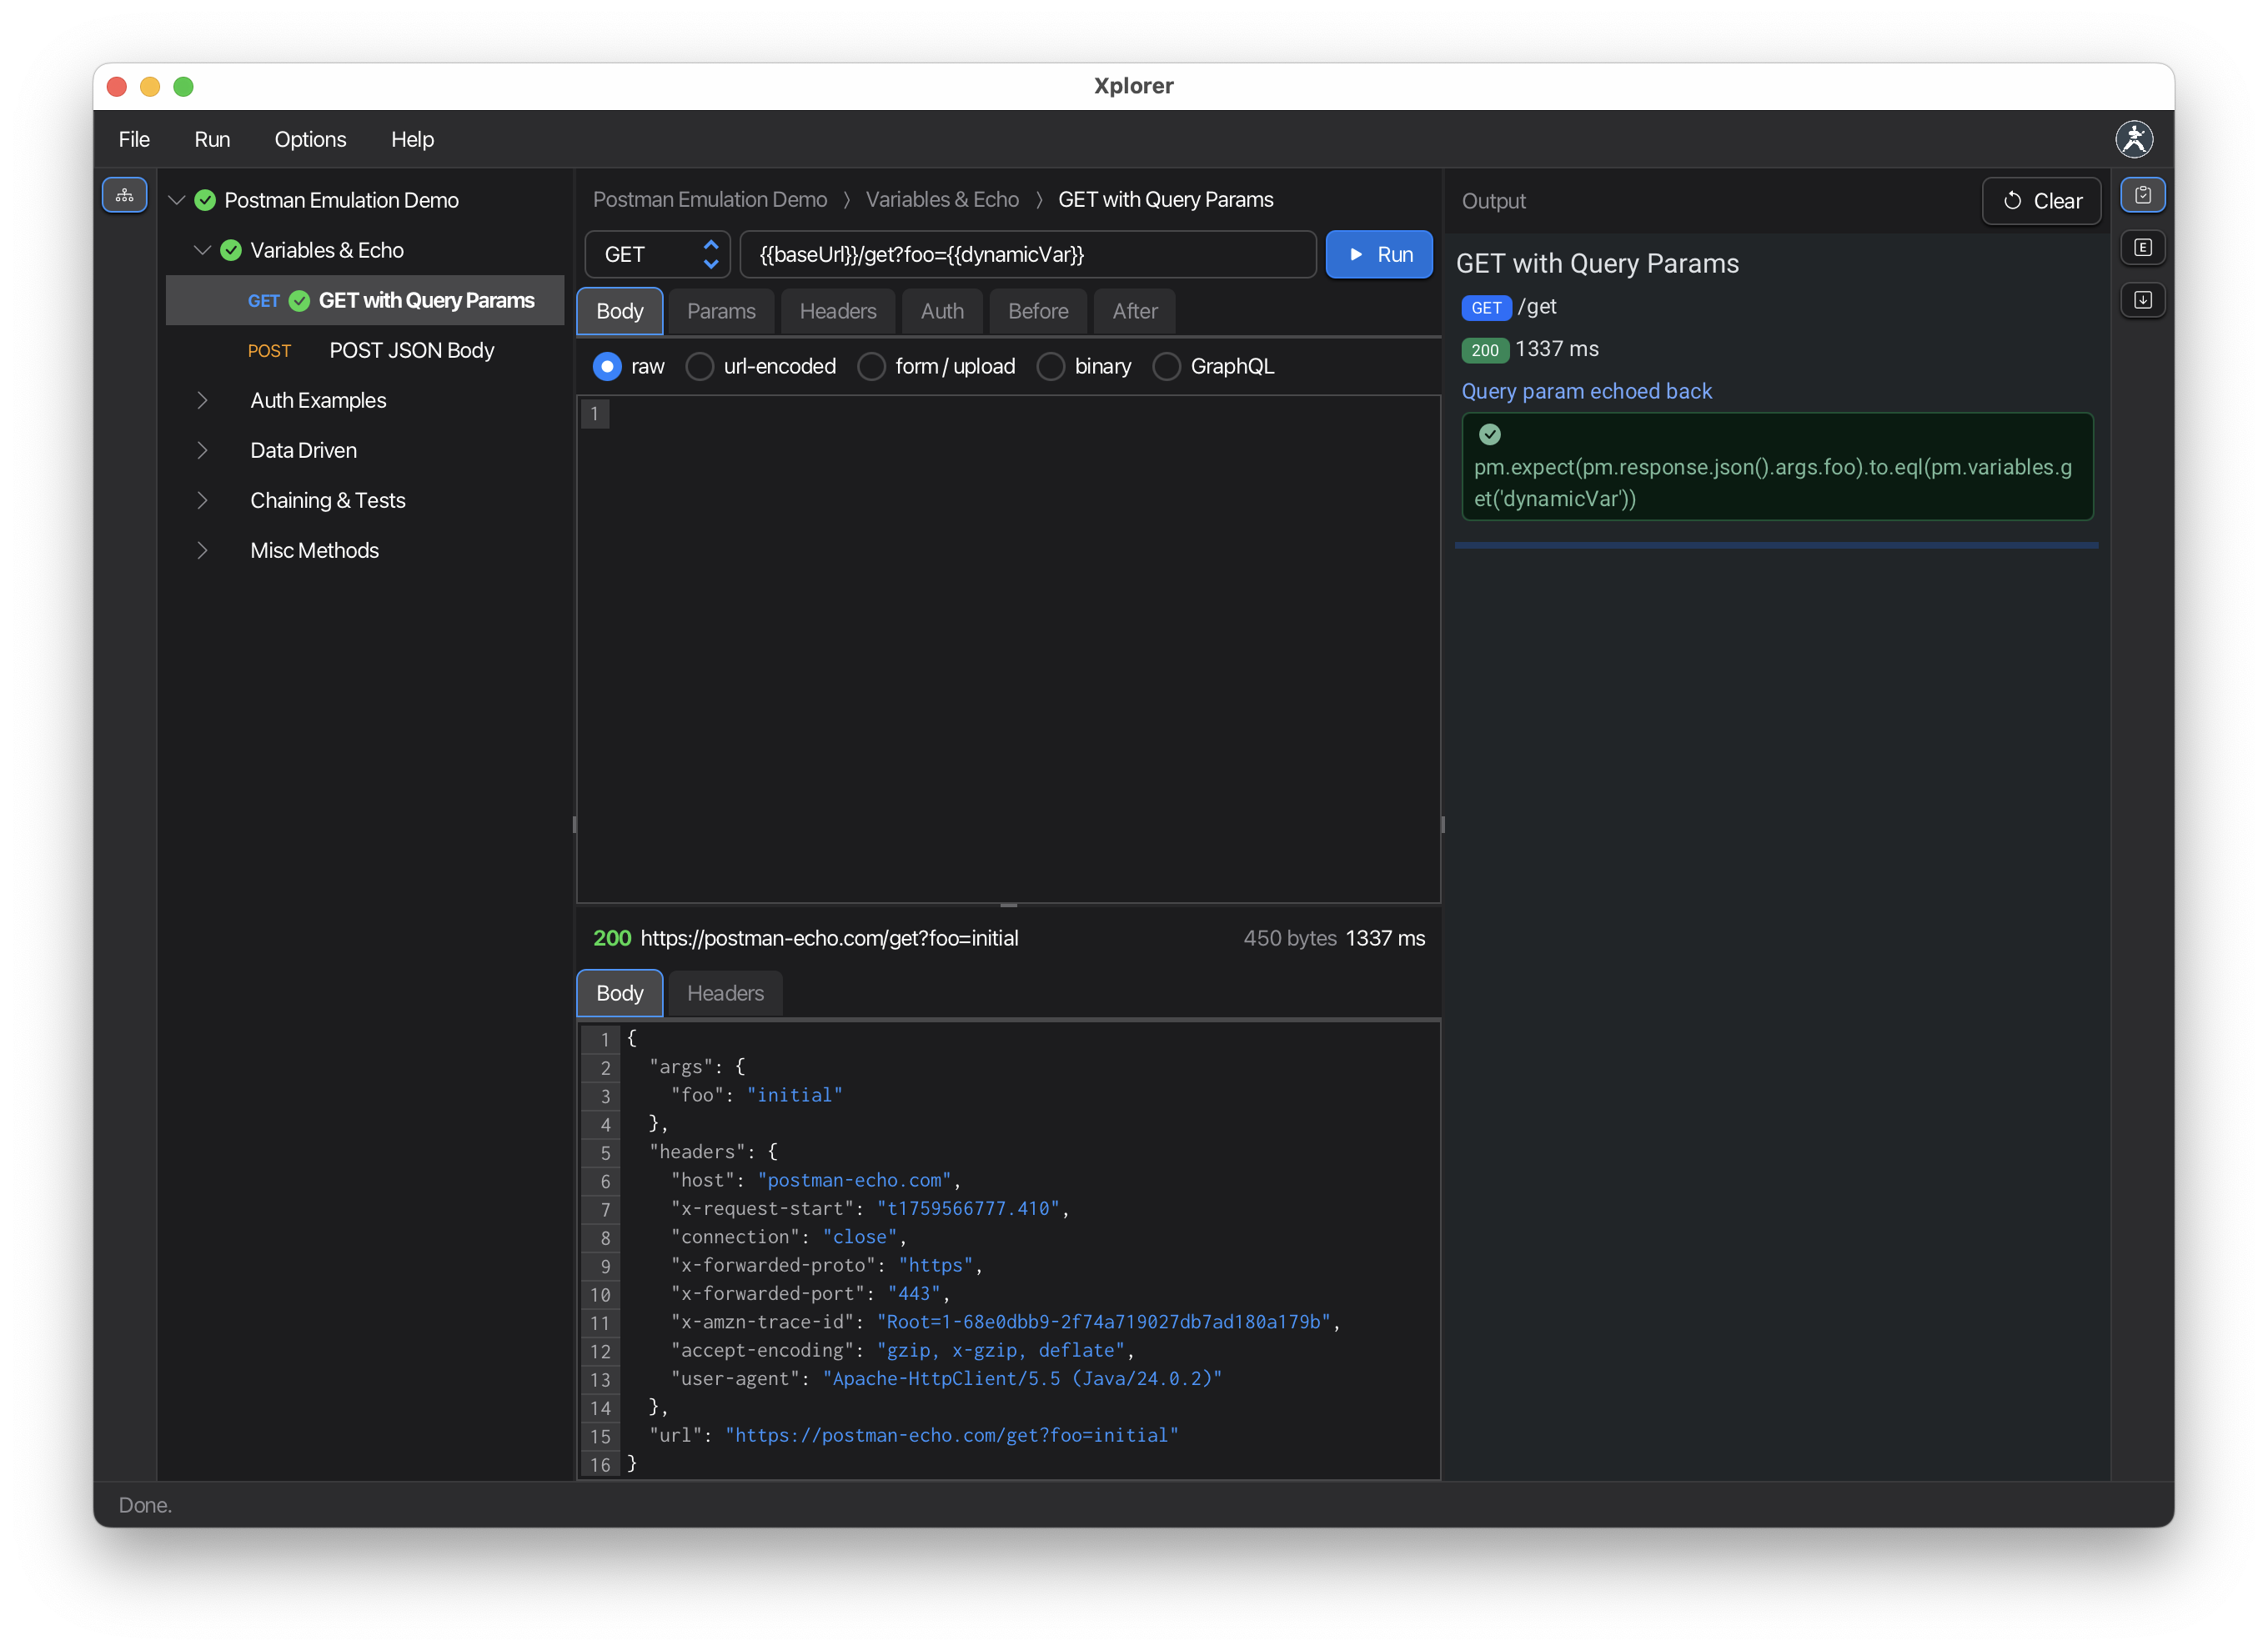
Center Panel: Request Details
When a request is selected, you’ll see:
Top Section
- Breadcrumb navigation showing request hierarchy
- HTTP method dropdown
- URL field
- Run button
Tabs
- Body: Configure request body (JSON, form-data, URL-encoded, etc.)
- Params: Query parameters
- Headers: HTTP headers
- Auth: Authentication settings
- Before: Pre-request scripts (JavaScript)
- After: Test scripts (JavaScript)
Bottom Section
- Response viewer showing status, headers, and body
Center Panel: Folder/Collection Details
When a folder or root collection is selected, you’ll see:
Tabs
- Variables: Collection variables (root level only)
- Auth: Default authentication for all requests
- Before: Pre-request scripts applied to all requests
- After: Test scripts applied to all requests
- CSV / JSON: Data file for data-driven testing
Right Panel: Tools
Toggle between three panes using the right toolbar:
Output Pane
Real-time HTML output showing:
- Test execution results
- Assertion results
- Pass/fail status for each test
- Detailed error messages
Environment Pane
Displays the active environment:
- Environment name
- All variables and their current values
- Variables update during execution
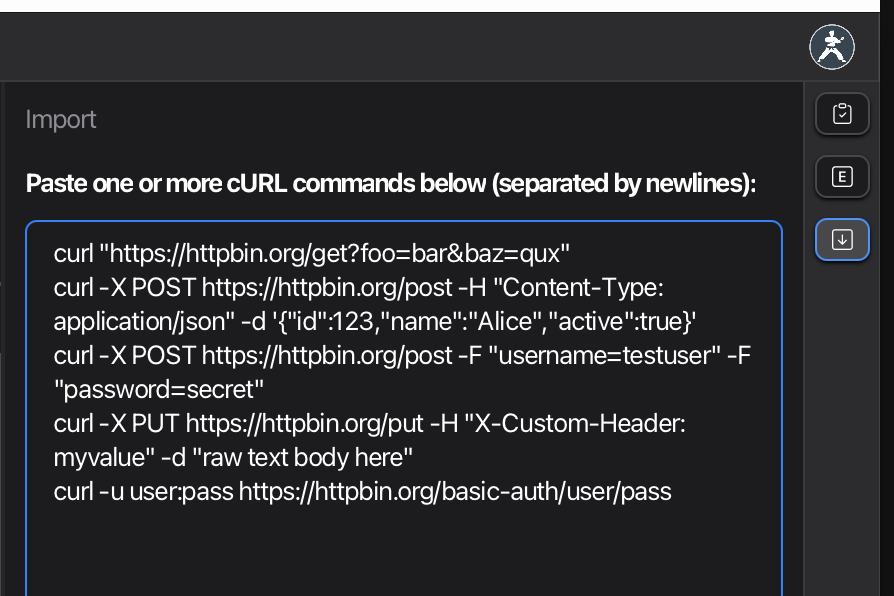
Import Pane
Tools for importing:
- cURL commands → requests
- Paste cURL and automatically convert
Context Menus
Right-click on tree items for actions:
For folders:
- Add Request
- Add Folder
- Remove Folder (except root)
For requests:
- Remove Request
At root level:
- Expand All
- Collapse All
Editing Request Names
Click any request or folder name to edit it inline. Press Enter or click away to save.
Themes & Display Options
Karate Xplorer supports multiple themes including dark mode, perfect for different working environments and presentations.
Theme Support:
- Light and dark modes available
- Seamless theme switching
Font Size Shortcuts:
- Cmd/Ctrl + - Increase font size
- Cmd/Ctrl - - Decrease font size
- Cmd/Ctrl 0 - Reset to default
These shortcuts are ideal for presentations and demos, allowing API product owners to quickly adjust visibility for their audience.
Clearing Results
Clear execution results at any level:
- Right-click on any node and select clear options
- Request level: Clear individual results
- Folder level: Clear all contained results
- Root level: Clear entire collection results